
Ruby Caches - Improving Caching Via Tooling
A series of posts will explore and detail some of the current Rails caching code. This post takes a deeper look at the network requests involved in caching.
These posts attempt to explain in more detail, but please do read the official Rails Caching Guide docs, which are also very good.
Rails Cache Posts:
- Rails Cache Initialization
- Rails Cache Comparisons
- Rails Cache Workflows
- Rails Cache Network Requests
- Rails Cache Local Cache Strategy
- Improving the Cache Layer Via Tooling
Ruby Cache Improvements
If you want to drive performance improvements for a library, you will need to understand some of the use cases and the structure of the code. We have covered how to use the Rails cache, and we took a deep look at the caching code workflow, including where time is most often spent, as well as digging into cache network requests to see where network IO time is spent. Now, if you want to start to improve caching, you can look at adding features to help avoid issues like cache stampede, or you can focus on reducing the latency for using the cache. This post will look at lowering latency when using the cache.
Understanding latency with benchmarks and profiles
If we want to make something faster we want data to help drive the improvements, often the best way to speed something up is using benchmarks and profilers. When I reach for one of these tools, I usually want both. I can use the benchmarks to see where I am in a range of options and conditions, then use the profiler to dig into specific use cases that don’t match my needs or expectations to target specific improvements. After fixing the profile, the increased performance is usually evident in the relevant benchmarks. Tooling like this can be a great feedback loop for driving improvements. It can also help avoid regressions. This is why, on many of the projects I work on, my team and I set up benchmarks and profiling as part of the CI pipeline. We have a complete history of performance improvements, and we can fail CI for significant regressions or at least investigate the regression, which is sometimes required for a bug fix or new feature.
A PR adding the benchmark and profile scripts to Dalli.
Benchmarking Dalli with GitHub Actions
Let’s examine how we can set up a suite of benchmarks for the Dalli Rubygem, which powers the Memcached flavor of Rails.cache.
create a new GitHub action with the content below .github/workflows/benchmarks.yml
name: Benchmarks

on: [push, pull_request]

jobs:
 build:
 runs-on: ubuntu-latest

 steps:
 - uses: actions/checkout@v4
 - name: Install Memcached 1.6.23
 working-directory: scripts
 env:
 MEMCACHED_VERSION: 1.6.23
 run: |
 chmod +x ./install_memcached.sh
 ./install_memcached.sh
 memcached -d
 memcached -d -p 11222
 - name: Set up Ruby
 uses: ruby/setup-ruby@v1
 with:
 ruby-version: 3.2
 bundler-cache: true # 'bundle install' and cache
 - name: Run Benchmarks
 run: RUBY_YJIT_ENABLE=1 BENCH_TARGET=all bundle exec bin/benchmark
This adds a new action that will install everything needed, run two instances of Memcached, and then run our benchmark script.
add the benchmark script bin/benchmark this file is large, so you can get it from the Dalli repo, some brief snippets below
#!/usr/bin/env ruby
# frozen_string_literal: true

# This helps benchmark current performance of Dalli
#
# run with:
# bundle exec bin/benchmark
# RUBY_YJIT_ENABLE=1 BENCH_TARGET=get bundle exec bin/benchmark
require 'bundler/inline'
require 'json'

gemfile do
 source 'https://rubygems.org'
 gem 'benchmark-ips'
 gem 'logger'
end

require_relative '../lib/dalli'
require 'benchmark/ips'

...a bunch more code...

if %w[all set].include?(bench_target)
  Benchmark.ips do |x|
    x.config(warmup: bench_warmup, time: bench_time, suite: suite)
    x.report('client set') { client.set('key', payload) }
    x.report('raw sock set') do
    sock.write("ms sock_key #{payload.bytesize} T3600 MS\r\n")
    sock.write(payload)
    sock.write("\r\n")
    sock.flush
    sock.readline # clear the buffer
  end
  x.compare!
  end
end
The benchmark lets us measure the iterations per second of all the command cache actions get, set, get_multi, and read_multi. For the benchmark, I compare against extremely simplified memcached access via a raw Ruby socket. This makes it easier to see what we can still improve, ensuring the abstractions in the Dalli gem are very performant and offer very low overhead compared to the fastest pure Ruby implementation you could expect.
This benchmark runs on all PRs and outputs the current iterations per second of all the methods we have configured. We can then make PRs and include the before-and-after expectations of the benchmark data.
Profiling Dalli with GitHub Actions
We also set up a similar CI action for profiling, so we are always capturing profiles and can look back if a PR has some unexpected change after we role it out. The same profiling tooling, while nice in CI, is also part of the very fast feedback loop along with the benchmark script when doing performance work.
create a new GitHub action for profiling .github/workflows/profile.yml
and add this content to the new file
name: Profiles

on: [push, pull_request]

jobs:
 build:
 runs-on: ubuntu-latest

 steps:
 - uses: actions/checkout@v4
 - name: Install Memcached 1.6.23
 working-directory: scripts
 env:
 MEMCACHED_VERSION: 1.6.23
 run: |
 chmod +x ./install_memcached.sh
 ./install_memcached.sh
 memcached -d
 - name: Set up Ruby
 uses: ruby/setup-ruby@v1
 with:
 ruby-version: 3.4
 bundler-cache: true # 'bundle install' and cache
 - name: Run Profiles
 run: RUBY_YJIT_ENABLE=1 BENCH_TARGET=all bundle exec bin/profile
 - name: Upload profile results
 uses: actions/upload-artifact@v4
 with:
 name: profile-results
 path: |
 client_get_profile.json
 socket_get_profile.json
 client_set_profile.json
 socket_set_profile.json
 client_get_multi_profile.json
 socket_get_multi_profile.json
 client_set_multi_profile.json
 socket_set_multi_profile.json
Similar to the benchmark, this installs the required things, gets the Memcached server up and running, and then kicks off our profile script. The action then uploads all of the profiling results, which can be retrieved after any CI run.
The profiling script is long, so you can get that from the Dalli repo, but below are some snippets
#!/usr/bin/env ruby
# frozen_string_literal: true

# This helps profile specific call paths in Dalli
# finding and fixing performance issues in these profiles should result in improvements in the dalli benchmarks
#
# run with:
# RUBY_YJIT_ENABLE=1 bundle exec bin/profile
require 'bundler/inline'
require 'json'

gemfile do
 source 'https://rubygems.org'
 gem 'benchmark-ips'
 gem 'vernier'
 gem 'logger'
end

require_relative '../lib/dalli'
require 'benchmark/ips'
require 'vernier'

... lots more setup code...

if %w[all set].include?(bench_target)
  Vernier.profile(out: 'client_set_profile.json') do
    start_time = Time.now
    client.set(dalli_key, payload, 3600, raw: true) while Time.now - start_time < bench_time
  end

  Vernier.profile(out: 'socket_set_profile.json') do
    start_time = Time.now
    while Time.now - start_time < bench_time
      sock.write("ms sock_key #{payload.bytesize} T3600 MS\r\n")
      sock.write(payload)
      sock.write("\r\n")
      sock.flush
      sock.readline # clear the buffer
    end
  end
end
Again, like the benchmarking script we can target all the most important caching actions, in many we can also compare the profile of the raw socket to our Dalli implementation to help find differences.
Developer workflow leveraging the benchmark and profiling tools
It depends on your needs, but let’s say we want to improve writing to the cache; perhaps we have noticed that some write-heavy workloads are not performing as well with Dalli as other cache implementations. Beyond having the benchmarks as part of CI, several applications include benchmarking scripts so we can compare benchmarks across various caching backends, which helps us spot unexpected differences.
Capture a Benchmark Baseline
We can capture a baseline by running the benchmark script and targetting the set method.
Warming up --------------------------------------
 client set   304.000 i/100ms
 raw sock set   827.000 i/100ms
Calculating -------------------------------------
 client set      2.998k (± 8.9%) i/s  (333.52 μs/i) -     29.792k in  10.009832s
 raw sock set      8.254k (± 2.8%) i/s  (121.15 μs/i) -     82.700k in  10.027442s
Comparison:
 raw sock set:     8254.3 i/s
 client set:     2998.4 i/s - 2.75x  slower
Profile the Target method
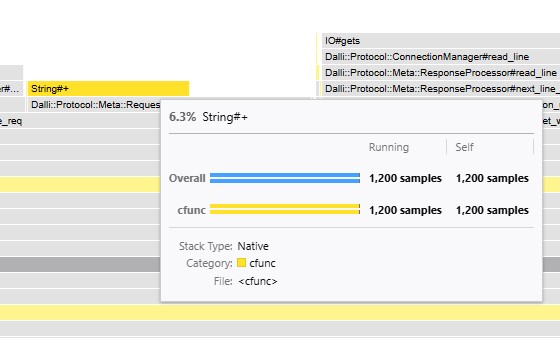
Then, we can profile the set method and look for unexpected spikes.
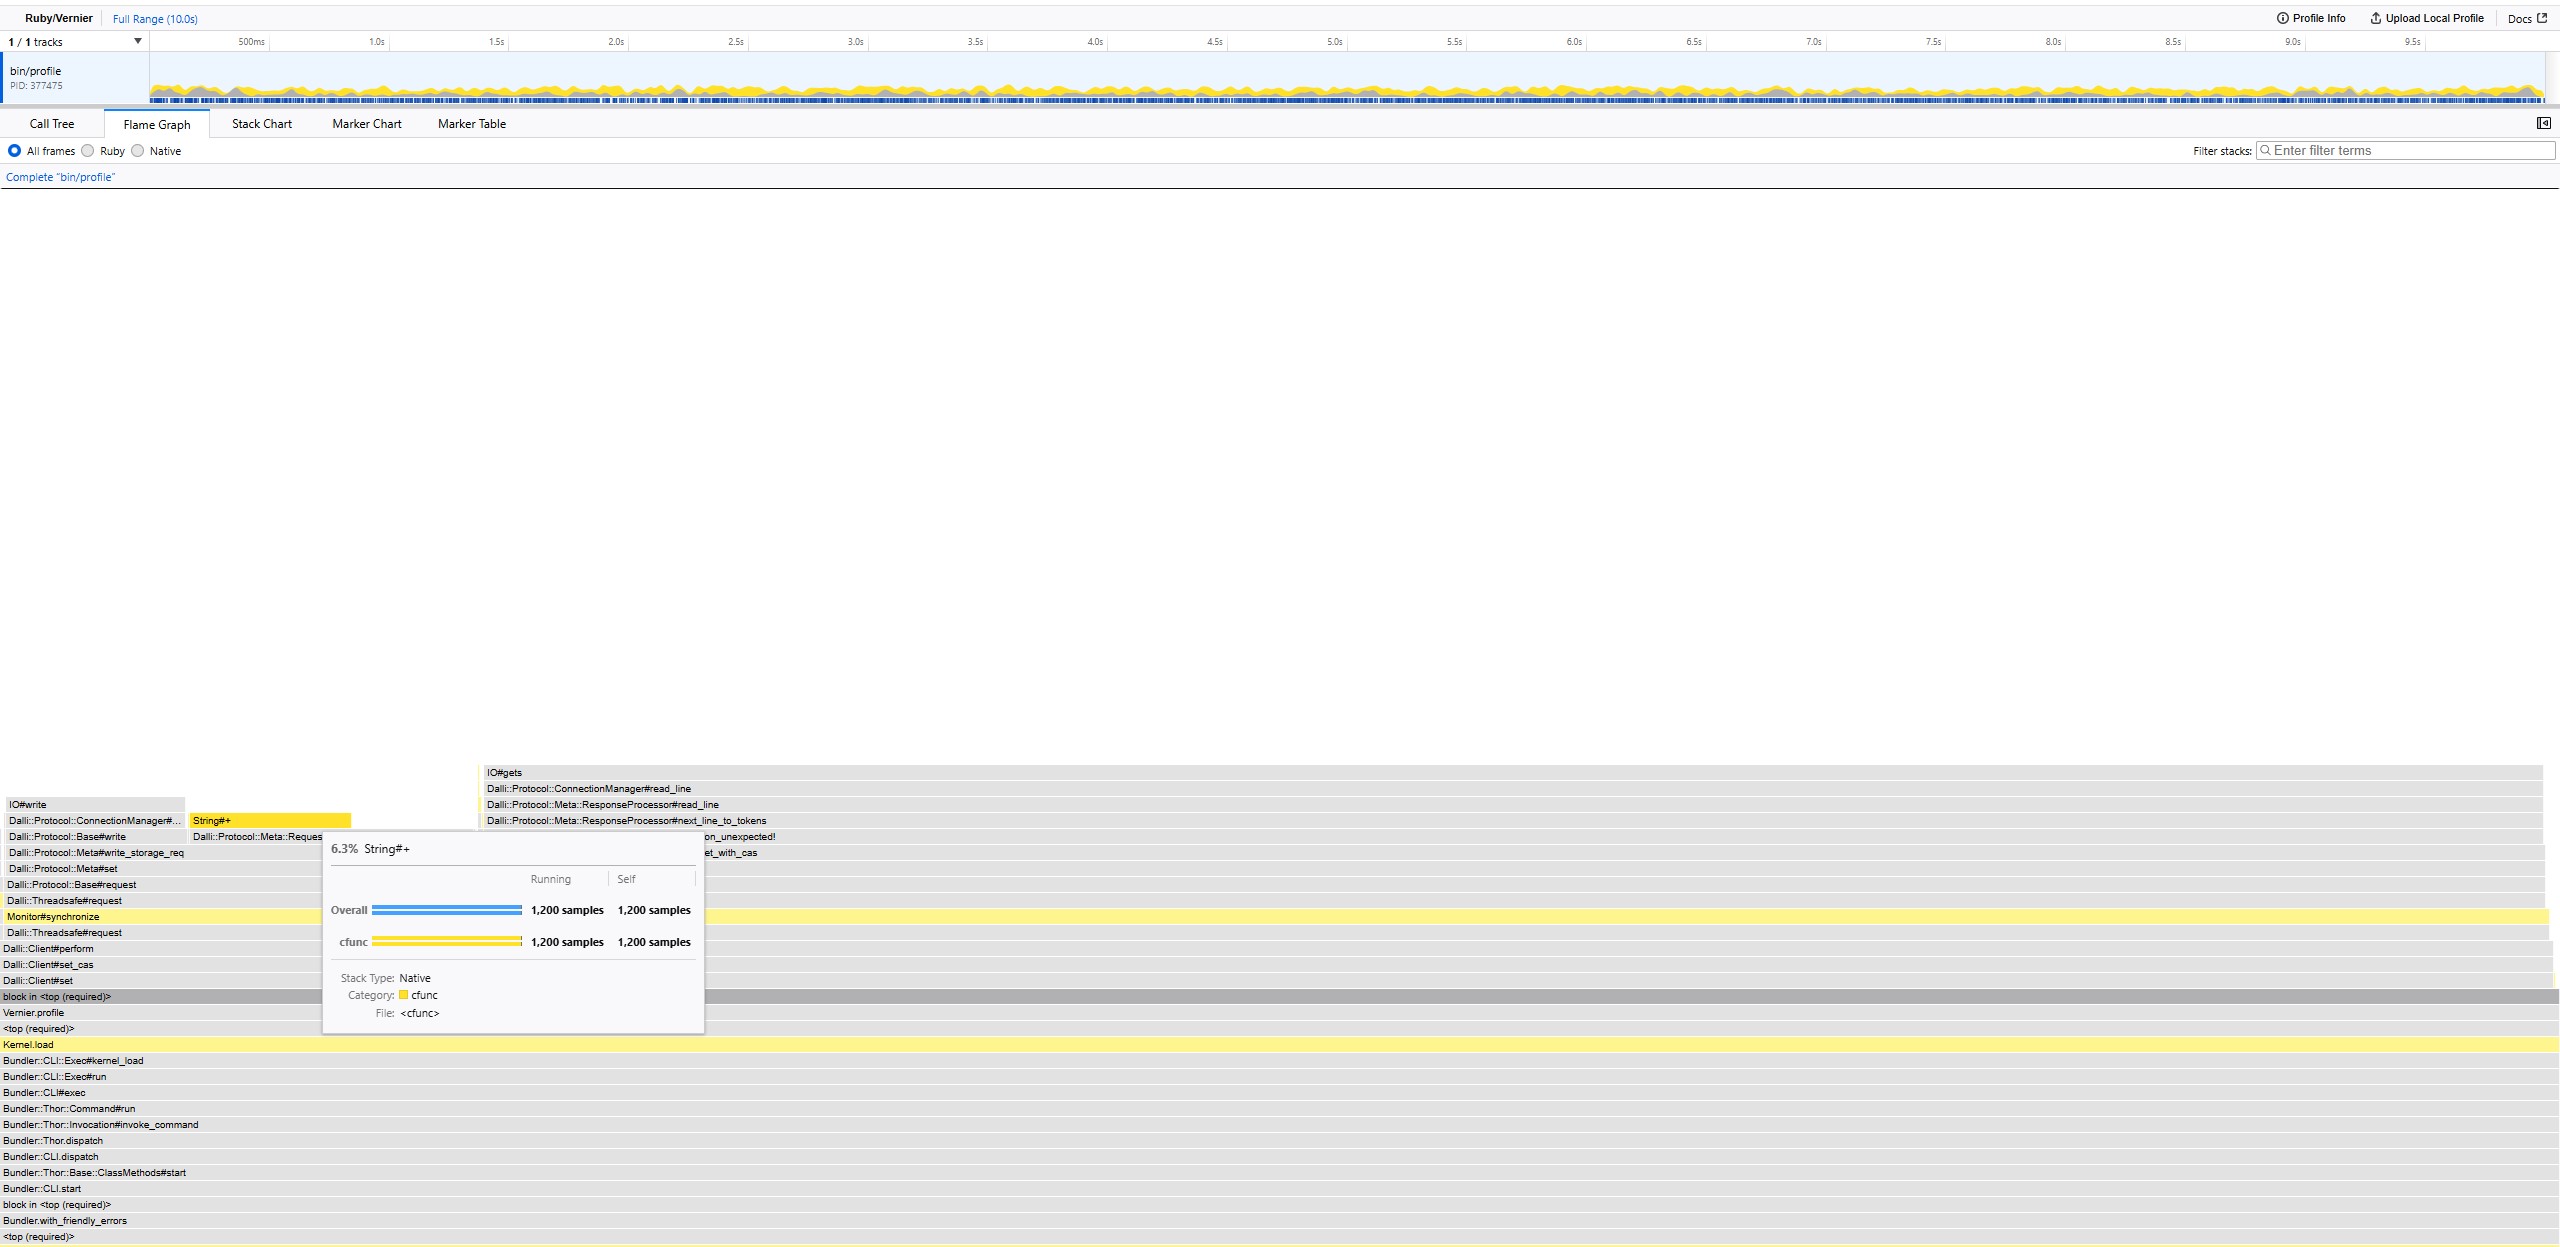
on this flame graph an important section with string manipulation jumps out
Why are we spending more than 6% of our time modifying a string?
The profiles help you track down where time is spent and possibly where time is wasted.
Refactor, iterate, fix hot spots
Now you have a good loop, make a small change, generate another profile run, and attempt to fix hotspots.
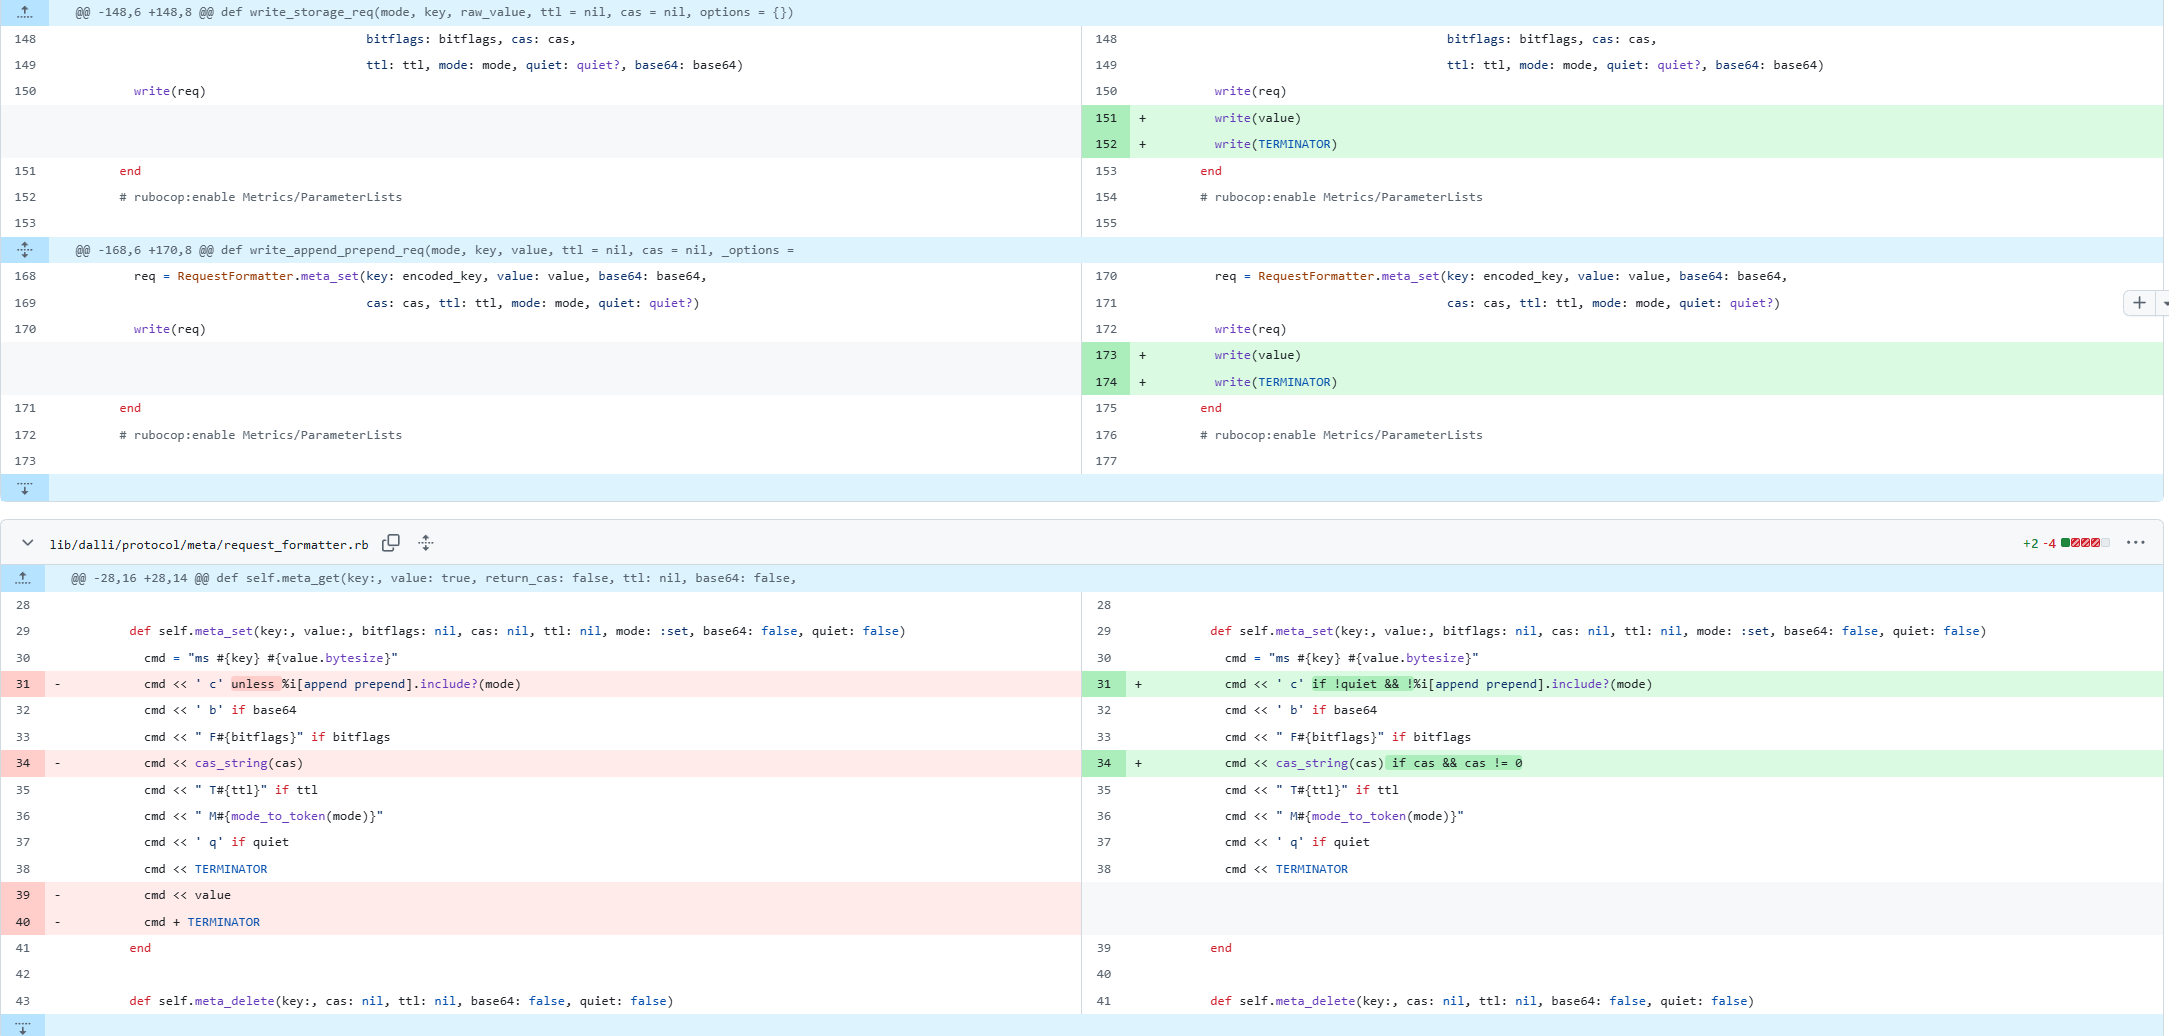
- primary win is by writing the value directly to the IO object
- This avoids copying a potentially very large string, which can cause numerous allocations when resizing the buffer
- some smaller wins avoiding some other string manipulation
After each code change, you can look at the new profile flame graph and see if it fixes the issue you were targeting.
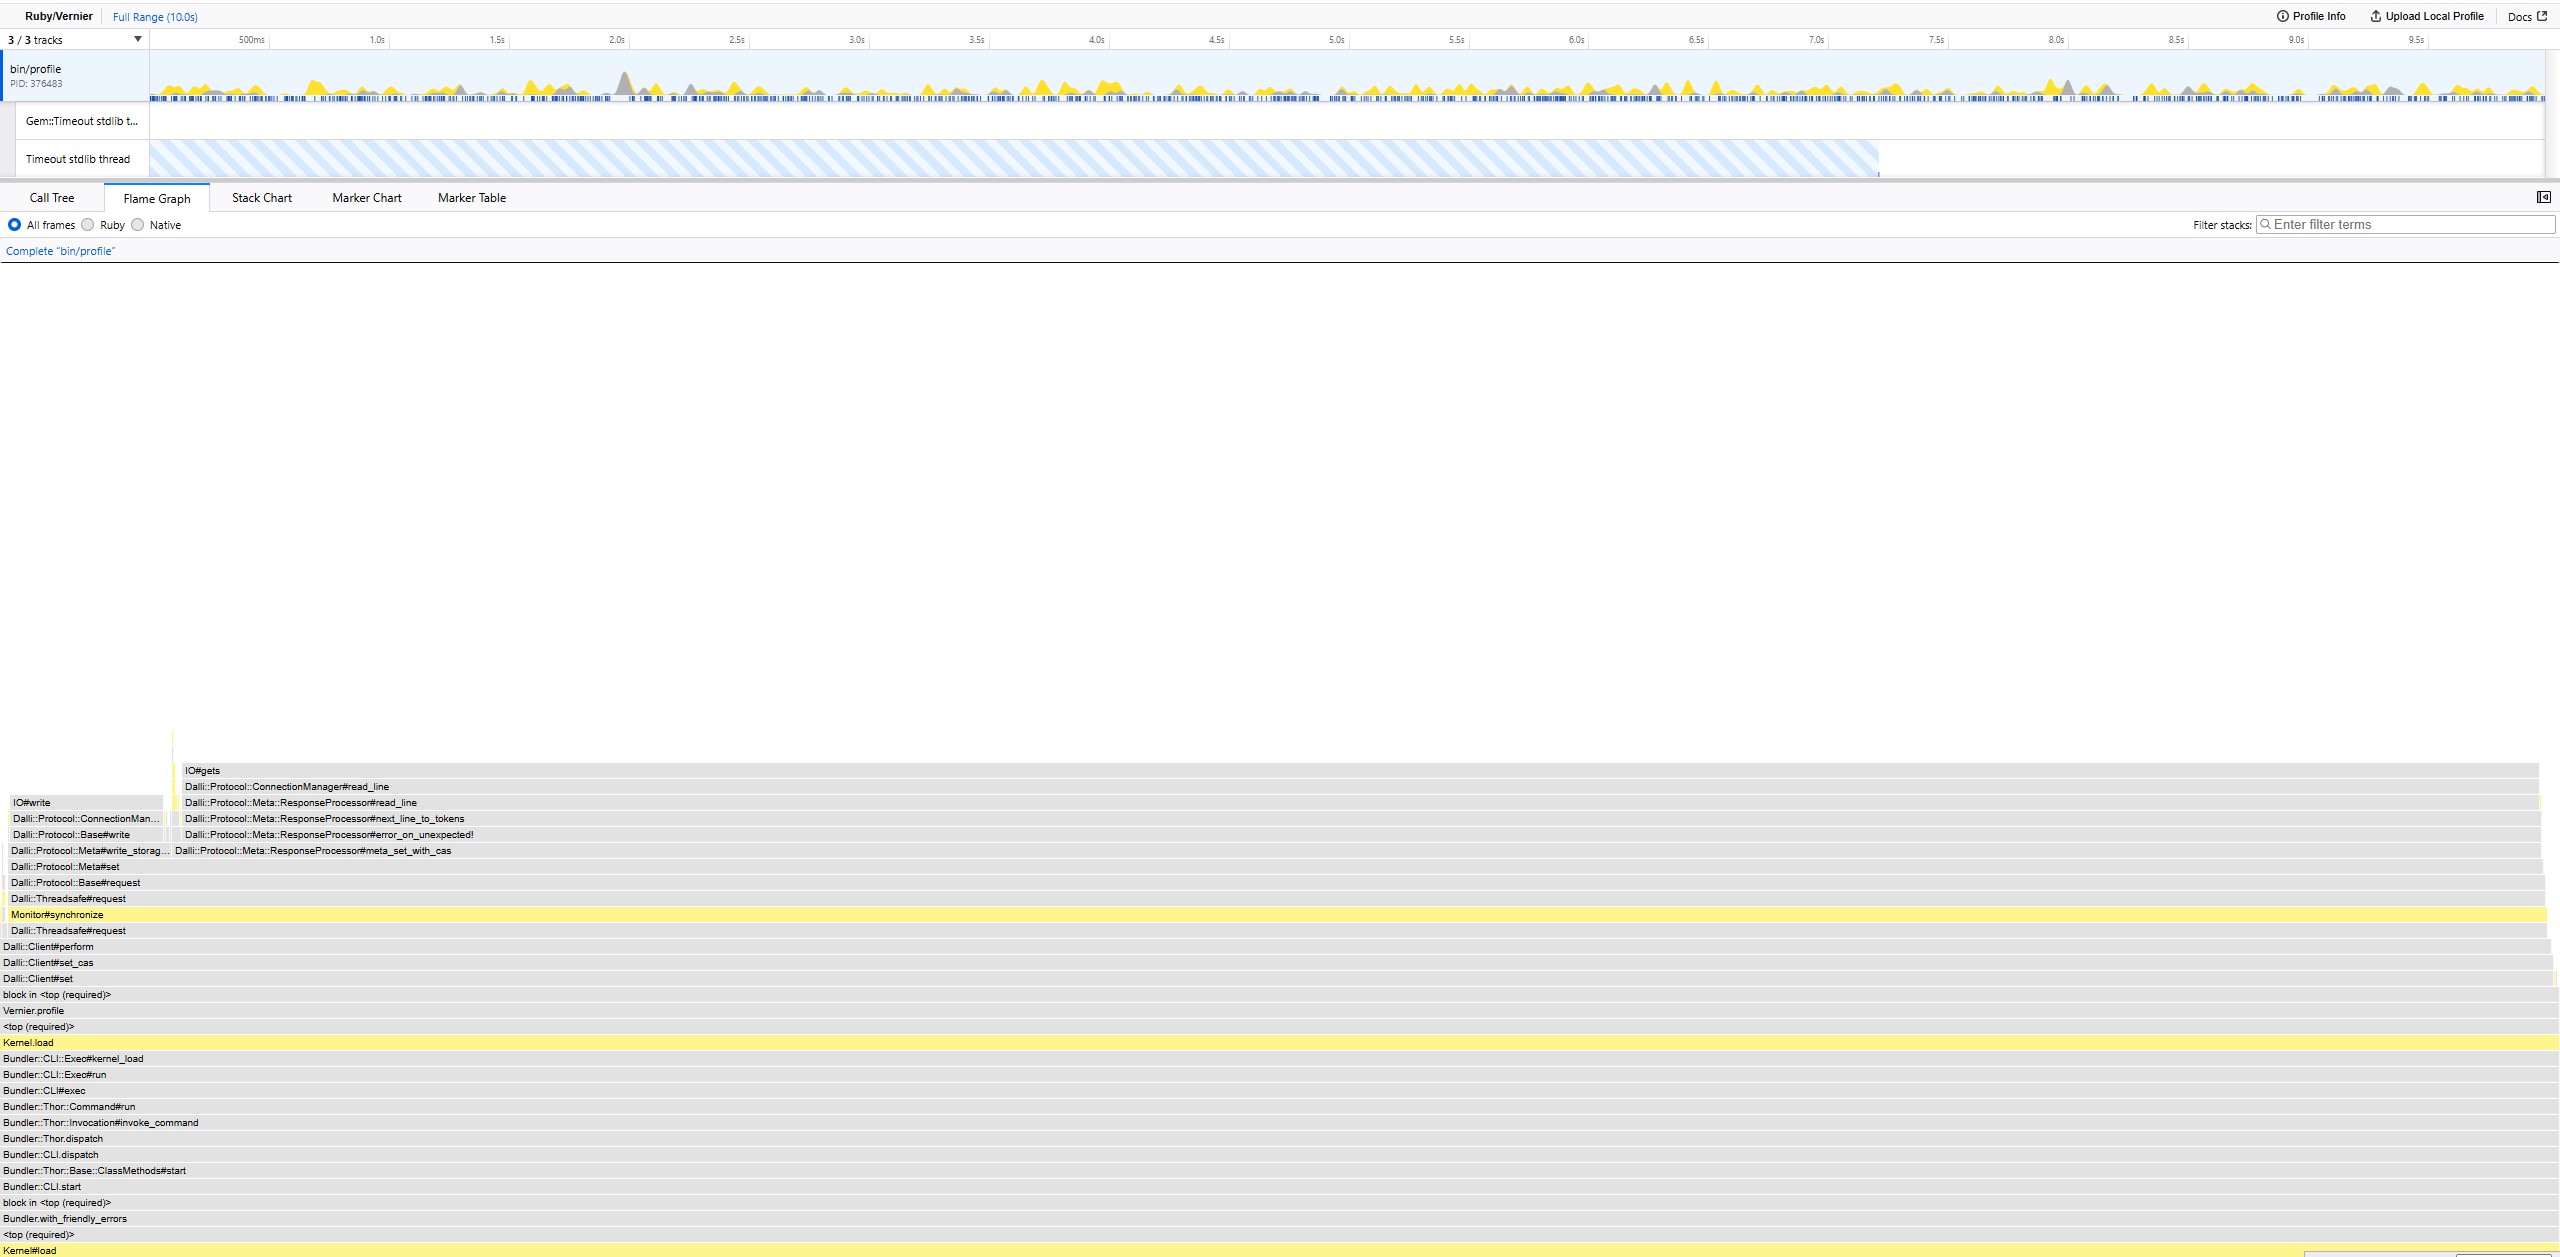
Then, finally, run your benchmarks again to see if fixing what you saw in the profile data improves your microbenchmark.
Warming up --------------------------------------
 client set   724.000 i/100ms
 raw sock set   828.000 i/100ms
Calculating -------------------------------------
 client set      7.434k (± 2.4%) i/s  (134.51 μs/i) -     74.572k in  10.037368s
 raw sock set      8.209k (± 4.5%) i/s  (121.82 μs/i) -     81.972k in  10.011659s
Comparison:
 raw sock set:     8208.7 i/s
 client set:     7434.2 i/s - 1.10x  slower
Rerun the benchmark
When you have fixed all the issues in the profile, you rerun the benchmark, and hopefully, the improvement makes a noticeable difference. While things are different in real-world applications, often, what shows up in your microbenchmark will translate into real-world improvements.
Ship your performance Improvement
You can now ship a PR that includes the before-and-after benchmark data and screenshots showing the improvement in the flame graph.
This basic workflow was followed for a real PR improving the set performance for dalli, which you can check out for complete details.
Invest in the toolchain
Since we invested in making these benchmark and profile scripts both available to run locally for developers and as part of CI, it makes it easier for anyone to make performance improvements. It also simplifies any bugs reported around performance as we should be able to review it within our tool chain or we can add the new use case as a path to optimize in our scripts.
Over time, this can help bring consistent improvement to a library and help avoid accidental regressions.
NOTE: At the moment, these improvements are on a research fork of Dalli, but we have talked with the Dalli maintainer and will start porting various improvements into the released gem.